Update 10/14/2013: The tool is now available as an extension on the Chrome Web Store.
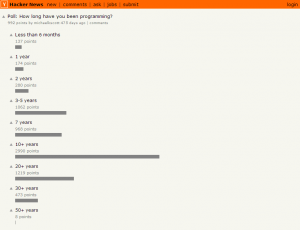
I was recently viewing a poll on Hacker News and thought it would be useful to visualize the results of the poll, so I wrote a script for generating bar charts. The image below shows an example.
The script can be used with the following bookmarklet or Greasemonkey script.
At the time of this post there are no polls on the HN front page, but here are some links to existing polls:
- Poll: What’s Your Favorite Programming Language?
- Poll: How long have you been programming?
- Poll: HN readers, where’s your residence?
Here are some other tools that can be used for visualizing Hacker News poll data (I have not tried all of these).
